

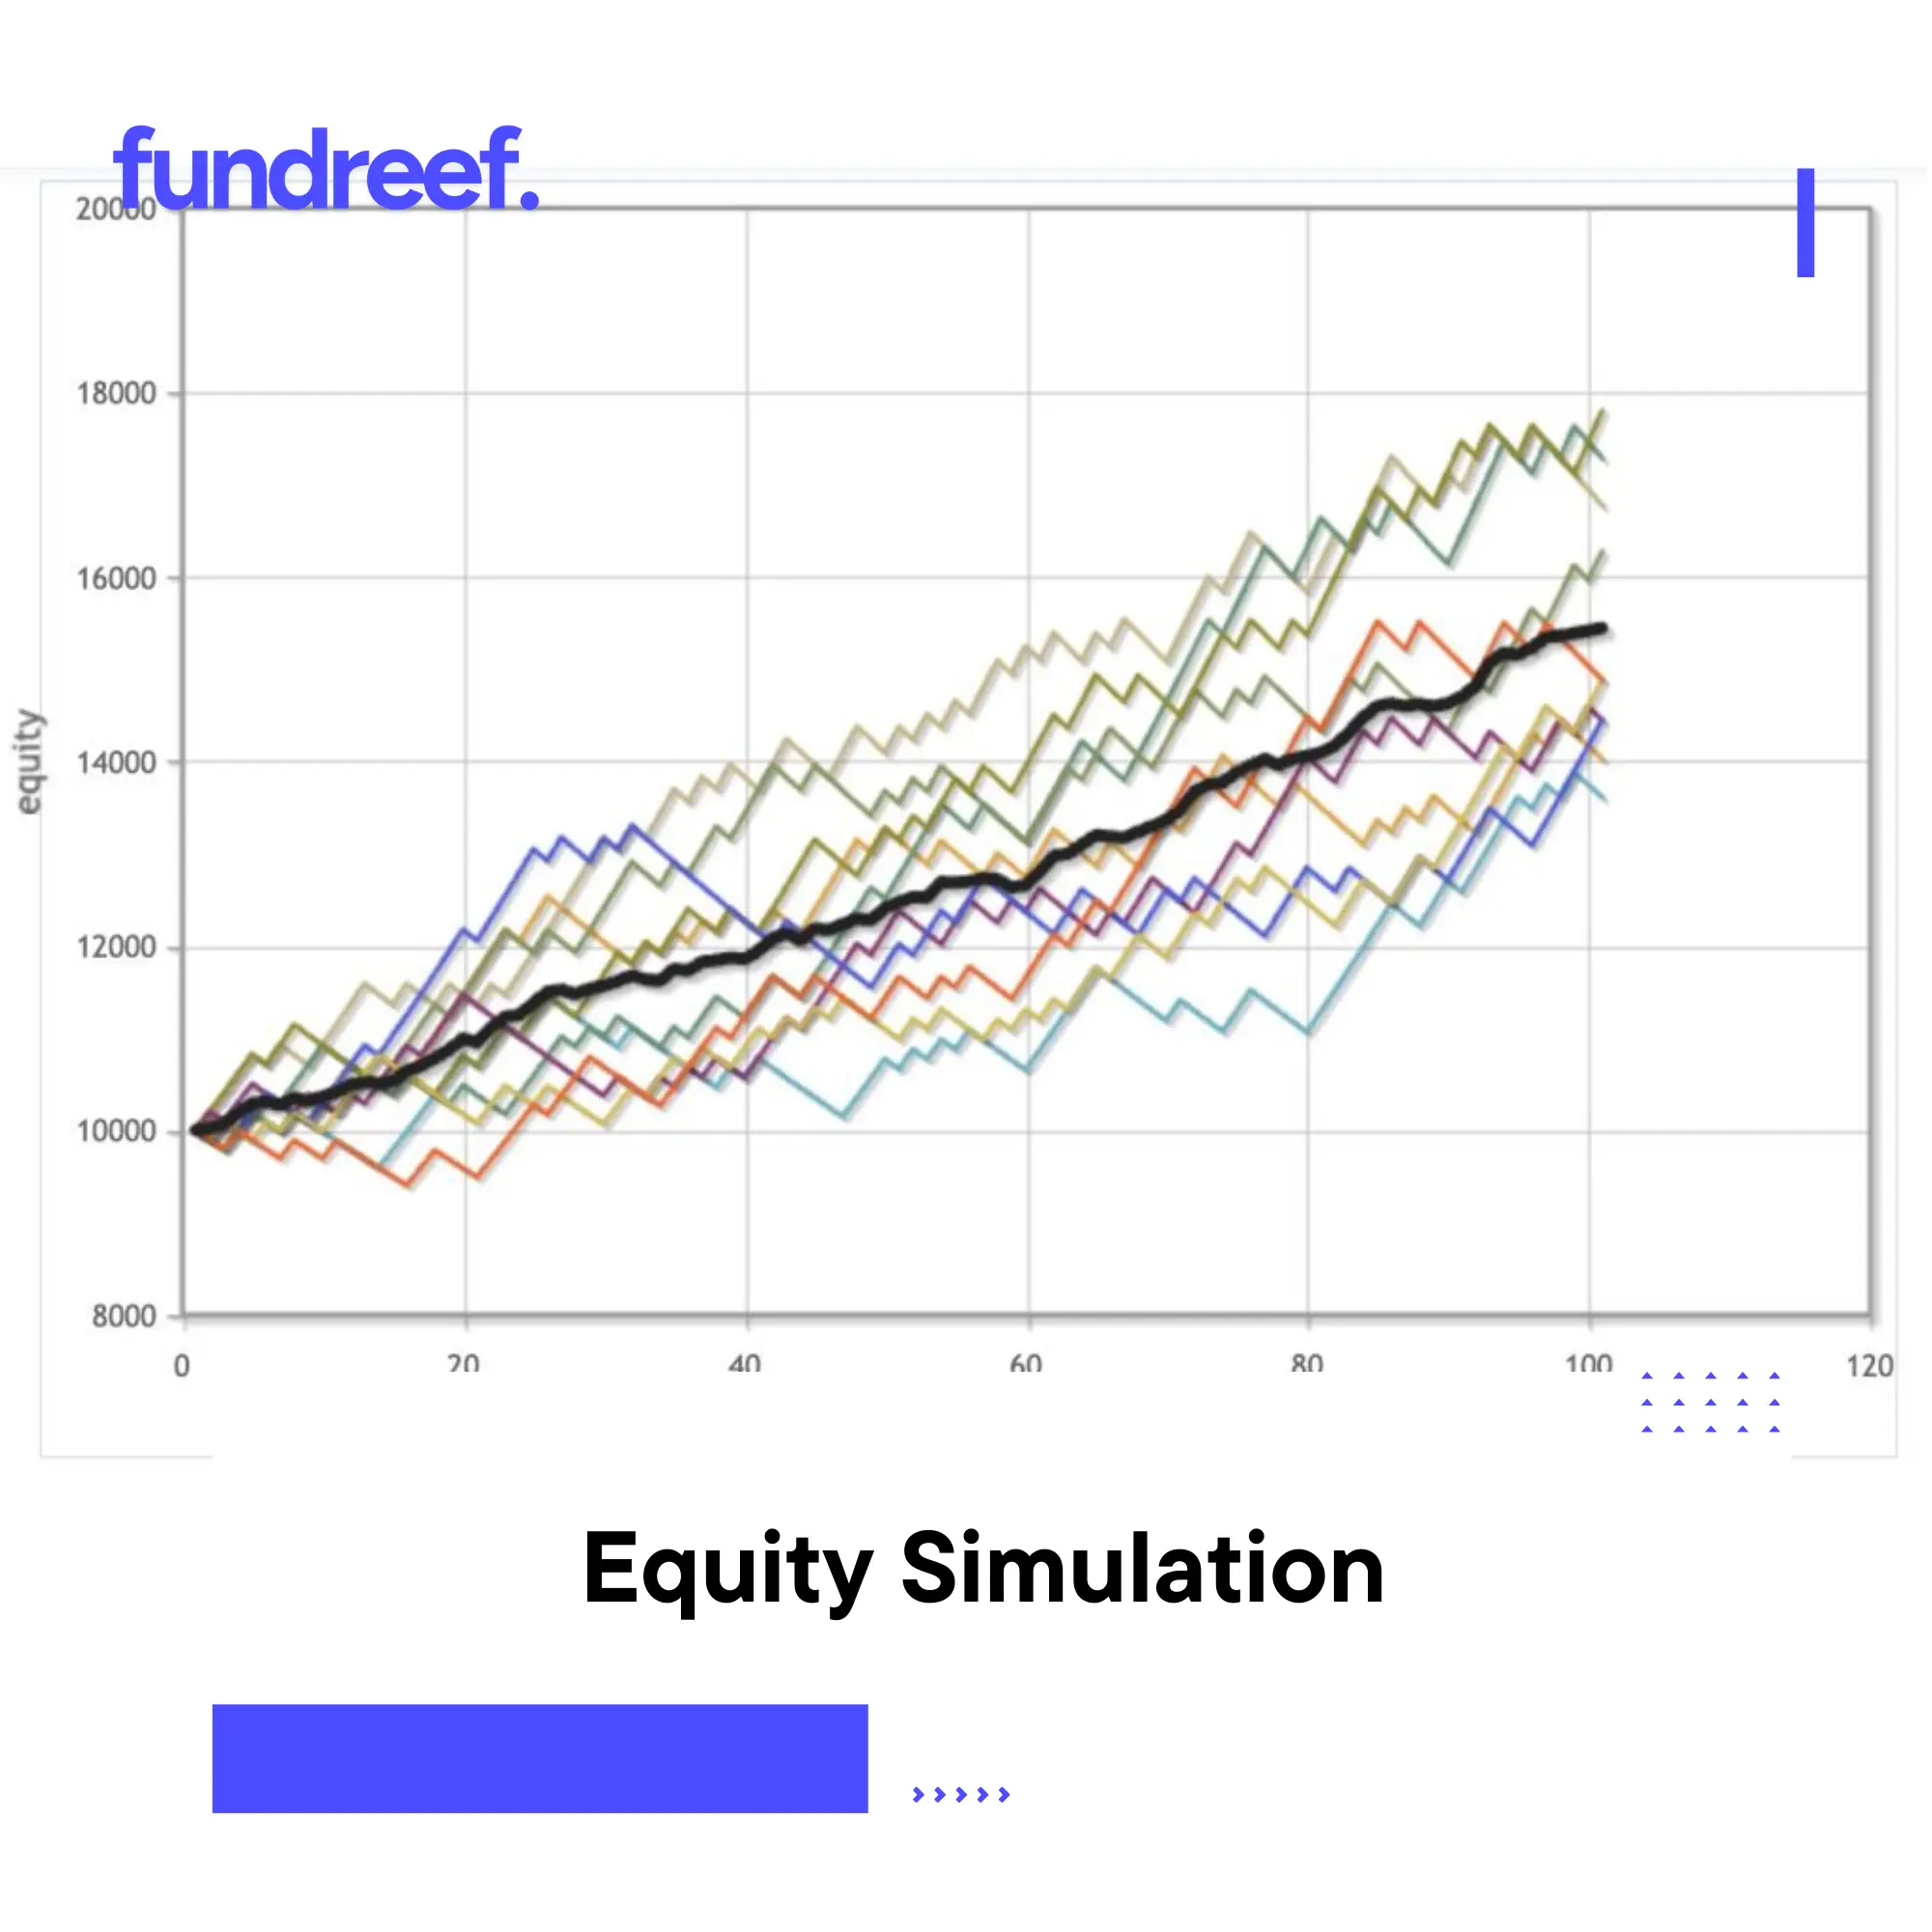
A founder who owns 50% after incorporating will typically own 35–45% after seed, 25–35% after Series A, 20–30% after Series B, and 15–25% after Series C—losing 65–70% of their original ownership across four funding rounds. But understanding dilution isn’t just about watching your percentage shrink; it’s about modeling absolute value: if your 50% of a $2M company becomes 20% of a $200M company, you went from $1M paper value to $40M—a 40x gain despite 60% dilution. Most founders don’t model these scenarios before raising, leading to panic when Series B investors demand 25% and founders realize they’ll drop below 20% ownership. Smart founders run equity simulations beforenegotiating term sheets, stress-testing dilution across 3–5 funding rounds to understand: “If I give up X% now, what do I own at exit?”
This guide shows exactly how to model dilution across multiple funding rounds, the formulas and math behind dilution calculations, how option pools compound dilution effects, anti-dilution provisions and their impact, real-world dilution scenarios from seed to IPO, and tools to simulate your own cap table evolution.
Table of Contents
- Understanding dilution: percentage vs absolute value
- How to calculate dilution across funding rounds
- Option pools and their compounding dilution effect
- Anti-dilution provisions: down round impact on founders
- Real-world dilution scenarios: seed to exit
- Tools and calculators for equity simulation
- Strategies to minimize dilution
- Frequently asked questions about equity dilution
1. Understanding dilution: percentage vs absolute value
1.1 Dilution definition
Dilution occurs when new shares are issued (to investors, employees, advisors), increasing total shares outstanding and decreasing existing shareholders’ ownership percentages.
Example:
- Before funding: You own 5M shares out of 10M total = 50% ownership
- Funding round: Investors receive 2.5M new shares for $5M investment
- After funding: You own 5M shares out of 12.5M total = 40% ownership
- Dilution: From 50% → 40% = 10 percentage point dilution (20% relative dilution)
1.2 Why dilution isn’t inherently bad
Bad dilution: Company raises $2M at $6M post-money (33% dilution), burns it in 12 months with no progress, then raises down round. Your equity shrinks and becomes less valuable.
Good dilution: Company raises $5M at $25M post-money (20% dilution), grows revenue 5x, then raises Series B at $100M valuation. Your percentage shrunk but absolute value increased.
The math:
- Before Series A: 40% of $5M pre-money company = $2M paper value
- After Series A: 32% of $25M post-money company = $8M paper value
- You were diluted 8 percentage points but gained $6M in value
Key insight: Focus on absolute value (percentage × valuation), not just percentage ownership.
1.3 Fully diluted vs basic ownership
Basic shares: Actual issued shares (common stock, preferred stock).
Fully diluted shares: Basic shares + all potential shares (unexercised options, warrants, convertible notes/SAFEs that will convert).
Why it matters: Investors negotiate ownership on a fully diluted basis. If they say “we want 20% post-money,” they mean 20% after all options, SAFEs, and convertibles are included.
Example:
- Basic shares: 10M
- Option pool (unexercised): 2M
- Convertible notes (will convert to 1M shares): 1M
- Fully diluted shares: 13M
If investor wants 20% post-money on fully diluted basis, they need 3.25M shares (20% of 16.25M total after their investment).
Always model dilution on fully diluted basis to avoid surprises.
2. How to calculate dilution across funding rounds
2.1 Single round dilution formula
Formula:\text{New Ownership %} = \text{Old Ownership %} \times (1 – \text{Investor %})
Example:
- You own 50% pre-round
- Investors get 20% of post-money
- Your new ownership: 50%×(1−20%)=50%×80%=40%
Alternative formula (from investment amount and valuation):\text{Investor %} = \frac{\text{Investment Amount}}{\text{Post-Money Valuation}}New Total Shares=Price Per ShareInvestment Amount
Example:
- Pre-money valuation: $8M
- Investment: $2M
- Post-money: $10M
- Investor ownership: $2M / $10M = 20%
- Existing shareholders diluted: 1 – 20% = 80% (everyone keeps 80% of what they had)
2.2 Multiple round dilution (compounding)
Dilution compounds across rounds. Each round dilutes the result of the previous round.
Example across 3 rounds:
Starting point: You own 50%
Round 1 (Seed):
- Investors get 15%
- Your new ownership: 50%×(1−15%)=50%×0.85=42.5%
Round 2 (Series A):
- Investors get 20%
- Your new ownership: 42.5%×(1−20%)=42.5%×0.80=34%
Round 3 (Series B):
- Investors get 20%
- Your new ownership: 34%×(1−20%)=34%×0.80=27.2%
Total dilution: From 50% → 27.2% = 22.8 percentage points (45.6% relative dilution)
Formula for cumulative dilution:Final Ownership=Initial Ownership×(1−r1)×(1−r2)×(1−r3)×…
Where r1,r2,r3 are investor percentages in each round.
2.3 Price per share calculation
Price Per Share=Total Shares OutstandingPre-Money Valuation
Example:
- Pre-money: $20M
- Shares outstanding: 10M
- Price per share: $20M / 10M = $2.00/share
New shares issued to investors:New Shares=Price Per ShareInvestment Amount
Example:
- Investment: $5M
- Price per share: $2.00
- New shares: $5M / $2.00 = 2.5M shares
Post-money shares: 10M + 2.5M = 12.5M
Investor ownership: 2.5M / 12.5M = 20%
2.4 Worked example: Seed → Series A → Series B
Initial state (incorporation):
- Founders: 10M shares (100% ownership)
- Valuation: $0 (pre-revenue)
Seed round:
- Pre-money: $4M
- Investment: $1M
- Post-money: $5M
- Investor %: $1M / $5M = 20%
- Price per share: $4M / 10M = $0.40/share
- New shares: $1M / $0.40 = 2.5M
- Total shares: 12.5M
- Founder ownership: 10M / 12.5M = 80%
Series A (18 months later):
- Pre-money: $20M
- Investment: $5M
- Post-money: $25M
- Investor %: $5M / $25M = 20%
- Total shares: 12.5M
- Price per share: $20M / 12.5M = $1.60/share
- New shares: $5M / $1.60 = 3.125M
- Total shares: 15.625M
- Founder ownership: 10M / 15.625M = 64% (diluted from 80%)
Series B (24 months later):
- Pre-money: $75M
- Investment: $20M
- Post-money: $95M
- Investor %: $20M / $95M = 21.05%
- Total shares: 15.625M
- Price per share: $75M / 15.625M = $4.80/share
- New shares: $20M / $4.80 = 4.167M
- Total shares: 19.792M
- Founder ownership: 10M / 19.792M = 50.5% (diluted from 64%)
Summary:
- Seed: 100% → 80% (20% dilution)
- Series A: 80% → 64% (16 percentage point dilution)
- Series B: 64% → 50.5% (13.5 percentage point dilution)
- Cumulative: 100% → 50.5% (49.5 percentage point dilution)
But absolute value:
- Pre-seed: 100% of $0 = $0
- Post-Series B: 50.5% of $95M = $48M paper value
3. Option pools and their compounding dilution effect
3.1 How option pools dilute founders
Investors require companies to create option pools (10–20% of post-money capitalization) to hire employees. Option pools dilute existing shareholders before the investment.
Why this matters: Option pools are created pre-money but calculated post-money, causing extra founder dilution.
Example (no option pool):
- Pre-money: $8M
- Investment: $2M
- Post-money: $10M
- Investor gets: 20% ($2M / $10M)
- Founders keep: 80%
Example (with 10% post-money option pool):
- Desired post-money: $10M
- Investor wants: 20%
- Option pool: 10% (post-money)
- This means investors + option pool = 30% of post-money
- Founders get: 70% (not 80%!)
The formula (option pool dilution):\text{Effective Pre-Money} = \text{Post-Money} \times (1 – \text{Investor %} – \text{Option Pool %})
Example:
- Post-money: $10M
- Investor: 20%
- Option pool: 10%
- Effective pre-money: $10M × (1 – 20% – 10%) = $10M × 70% = $7M
Founders are diluted by both investor % AND option pool %.
3.2 Option pool expansion (top-up dilution)
If you already have a 5% option pool and investors demand 15% post-money pool, you need to top up by 10%. This top-up dilutes founders before the round.
Example:
- Existing option pool: 5% (of current shares)
- Investor requires: 15% post-money pool
- Top-up needed: 10%
- This 10% dilutes founders immediately
Formula (top-up dilution):\text{Top-Up %} = \frac{\text{Target Pool %} – \text{Existing Pool %}}{1 – \text{Target Pool %}}
Example:
- Target: 15% post-money
- Existing: 5%
- Top-up: (15% – 5%) / (1 – 15%) = 10% / 85% = 11.76%
Founders get diluted 11.76% before investor dilution kicks in.
3.3 Modeling option pool impact
Scenario: Series A with option pool expansion
Starting point:
- Founders: 80% (post-seed)
- Seed investors: 15%
- Existing option pool: 5%
- Total: 100%
Series A terms:
- Investment: $5M at $20M post-money (20% investor stake)
- Require 15% post-money option pool (currently 5%, need 10% top-up)
Step 1: Top up option pool (dilutes everyone proportionally)
- Top-up: 10% / (1 – 10%) = 11.11% dilution
- Founders: 80% × (1 – 11.11%) = 71.1%
- Seed investors: 15% × (1 – 11.11%) = 13.3%
- Option pool: 5% × (1 – 11.11%) + 10% top-up = 4.4% + 10% = 14.4%
- (Note: 14.4% ≈ 15% post-Series A due to rounding)
Step 2: Issue shares to Series A investors (20% of post-money)
- Founders: 71.1% × (1 – 20%) = 56.9%
- Seed investors: 13.3% × (1 – 20%) = 10.6%
- Option pool: 14.4% × (1 – 20%) = 11.5% → but top-up brings it to 15% post-money
- Series A: 20%
Result: Founders went from 80% → 56.9% (23.1 percentage point dilution from both option pool top-up and investor stake).
4. Anti-dilution provisions: down round impact on founders
4.1 How anti-dilution works
If you raise a down round (lower price per share than previous round), investors with anti-dilution protection get additional shares to compensate, diluting founders extra.
Two types:
Full ratchet (worst for founders): Previous investors’ price adjusts to new lower price, regardless of how much capital was raised.
Weighted average (standard): Previous investors’ price adjusts proportionally based on how much new capital was raised at lower price.
4.2 Full ratchet example
Series A:
- Investor bought 2M shares at $2.00/share ($4M invested)
- Owns 20%
Series B (down round):
- New price: $1.00/share (50% down)
- Full ratchet: Series A investor’s price adjusts to $1.00
- Their $4M investment now converts to 4M shares (instead of 2M)
- They just got 2M extra shares for free
Who gets diluted? Founders and employees (common shareholders), not Series B investors.
Founder impact:
- Before Series B: Founders own 60% (6M shares out of 10M)
- After full ratchet + Series B: Founders own ~35% (6M shares out of ~17M total)
- Extra dilution: 25 percentage points beyond normal Series B dilution
4.3 Weighted average (broad-based) example
Formula:New PriceA=Old Shares+New Shares(Old Shares×Old PriceA)+(New Shares×New PriceB)
Series A:
- 2M shares at $2.00/share
- Total shares before Series B: 10M
Series B (down round):
- Raising $3M at $1.00/share (3M new shares)
Weighted average adjustment:New PriceA=10M+3M(10M×$2.00)+(3M×$1.00)=13M$20M+$3M=$1.77/share
Series A investor adjustment:
- Old shares: 2M at $2.00 (worth $4M)
- New conversion: $4M / $1.77 = 2.26M shares
- Extra shares: 0.26M (much less than full ratchet’s 2M)
Founder impact: Still diluted extra, but ~10% instead of ~25%.
4.4 Modeling down rounds in equity simulations
When simulating future rounds, always model down round scenarios to stress-test dilution.
Example scenario:
- Series A at $25M post-money (you own 60%)
- Series B planned at $100M post-money (20% dilution → you’d own 48%)
- Series B down round at $20M post-money with weighted average anti-dilution (30% dilution → you own 42%)
Difference: 6 percentage points of extra dilution if down round happens.
5. Real-world dilution scenarios: seed to exit
5.1 Typical founder ownership trajectory
| Stage | Typical Founder Ownership | Cumulative Dilution from Start |
|---|---|---|
| Incorporation | 50% (2 co-founders, equal split) | 0% |
| Post-Seed | 35–45% | 10–30% |
| Post-Series A | 25–35% | 30–50% |
| Post-Series B | 20–30% | 40–60% |
| Post-Series C | 15–25% | 50–70% |
| Post-Series D+ | 10–20% | 60–80% |
Pattern: Founders lose 5–15 percentage points per round, compounding to 60–80% total dilution by late stage.
5.2 Scenario 1: Capital-efficient path (high valuation jumps)
Assumptions:
- Start: 50% ownership
- Seed: 15% dilution ($1M at $5M post)
- Series A: 20% dilution ($5M at $25M post)
- Series B: 20% dilution ($15M at $75M post)
- Exit: $300M acquisition
Ownership trajectory:
- Incorporation: 50%
- Post-Seed: 50% × 0.85 = 42.5%
- Post-Series A: 42.5% × 0.80 = 34%
- Post-Series B: 34% × 0.80 = 27.2%
- At exit: 27.2% of $300M = $81.6M
Absolute value growth:
- Pre-seed: 50% of $0 = $0
- Post-seed: 42.5% of $5M = $2.1M
- Post-A: 34% of $25M = $8.5M
- Post-B: 27.2% of $75M = $20.4M
- Exit: 27.2% of $300M = $81.6M
Despite 45% relative dilution (50% → 27.2%), absolute value grew 40x.
5.3 Scenario 2: Aggressive growth path (more rounds, more dilution)
Assumptions:
- Start: 50% ownership
- Seed: 15% dilution
- Series A: 25% dilution
- Series B: 25% dilution
- Series C: 20% dilution
- Series D: 20% dilution
- Exit: $1B IPO
Ownership trajectory:
- Incorporation: 50%
- Post-Seed: 42.5%
- Post-A: 42.5% × 0.75 = 31.9%
- Post-B: 31.9% × 0.75 = 23.9%
- Post-C: 23.9% × 0.80 = 19.1%
- Post-D: 19.1% × 0.80 = 15.3%
- At exit: 15.3% of $1B = $153M
Despite 69% relative dilution (50% → 15.3%), absolute value is $153M.
5.4 Scenario 3: Danger zone (too much dilution, low exit)
Assumptions:
- Start: 50% ownership
- Seed: 25% dilution (overpaid early investor)
- Series A: 30% dilution (down round with anti-dilution)
- Series B: 30% dilution
- Exit: $50M acquisition (lower than hoped)
Ownership trajectory:
- Incorporation: 50%
- Post-Seed: 50% × 0.75 = 37.5%
- Post-A: 37.5% × 0.70 = 26.3%
- Post-B: 26.3% × 0.70 = 18.4%
- At exit: 18.4% of $50M = $9.2M
Still good outcome, but far below $100M+ scenarios above.
Warning sign: If you’re below 20% ownership before Series C and company isn’t valued at $500M+, you may not achieve life-changing exit.
5.5 When dilution becomes problematic
- Ownership drops below 25% before Series B
- Down rounds with full ratchet anti-dilution
- Raising more than 40% of company in any single round
- Multiple flat or down rounds (compounds dilution without value creation)
Target: Maintain 20–30% ownership through Series B, 15–25% through Series C. Below 15%, you need $1B+ exit to make dilution worthwhile.
6. Tools and calculators for equity simulation
6.1 Free online dilution calculators
| Tool | Best For | Features |
|---|---|---|
| SeedBlink Equity Calculator | Quick single-round estimates | SAFE, dilution, ownership calculations |
| Ideaproof Equity Dilution Calculator | Multi-round modeling | Cap table, SAFE conversion, export |
| Futureproof Dilution Calculator | Scenario planning | Models SAFEs, option pools, priced rounds |
| UserJot Dilution Calculator | Simple use, no signup | Multi-round tracking, ownership charts |
6.2 Cap table management software (with simulation features)
| Platform | Pricing | Simulation Features |
|---|---|---|
| Carta | $2k–$15k/year | Full scenario modeling, waterfall analysis, down round anti-dilution |
| Pulley | Free–$500/month | Multi-round simulations, option pool planning, exit scenarios |
| AngelList Stack | Free for small teams | Basic dilution modeling, SAFE/note conversion |
| Capshare | $500–$2k/year | Scenario planning, employee equity |
6.3 Excel/Google Sheets templates
DIY option: Build your own cap table with simulation tabs.
Key tabs to include:
- Current cap table (who owns what now)
- Funding assumptions (how much raising, at what valuation, per round)
- Dilution model (formulas calculating ownership after each round)
- Exit scenarios (absolute value at different exit valuations)
Formulas needed:
- Price per share:
=Pre-Money Valuation / Total Shares - New shares:
=Investment Amount / Price Per Share - New ownership:
=Old Ownership * (1 - Investor %) - Absolute value:
=Ownership % * Exit Valuation
6.4 What to model
Essential scenarios:
- Base case: Expected valuations, typical dilution (15–25% per round)
- Optimistic case: Higher valuations, less dilution (10–15% per round)
- Pessimistic case: Down rounds, anti-dilution triggers, higher dilution (30–40% per round)
- Option pool expansion: Model 10%, 15%, 20% post-money pools
- Exit outcomes: $50M, $100M, $500M, $1B exit values
Run all 5 scenarios before negotiating any term sheet.
When building your fundraising strategy and modeling dilution across multiple rounds, platforms like Fundreef help you research investor dilution patterns—filter by “average equity taken per round,” “option pool requirements,” and “founder ownership at exit” to benchmark your cap table against similar companies and identify investor funds that take fair equity stakes vs those who over-dilute founders systematically.
7. Strategies to minimize dilution
7.1 Raise at higher valuations
Obvious but critical: Every $5M increase in pre-money valuation reduces dilution by ~5 percentage points (for same investment amount).
Example:
- Raising $5M at $15M pre ($20M post) = 25% dilution
- Raising $5M at $20M pre ($25M post) = 20% dilution
- 5 percentage point difference
How to get higher valuations: Show traction, run competitive process, leverage multiple term sheets.
7.2 Raise less capital per round
Trade-off: Lower dilution but shorter runway.
Example:
- Raise $3M instead of $5M at $20M post
- Dilution: 15% instead of 25%
- Savings: 10 percentage points
When this works: You have capital-efficient growth (low burn, strong unit economics) and can reach next milestone with less capital.
When it doesn’t: You run out of money before hitting milestones, forced into bridge or down round.
7.3 Negotiate smaller option pools
Default investor ask: 15–20% post-money option pool.
Founder counter: 10–12% pool if you have key hires already (less future hiring risk).
Dilution impact:
- 20% pool: Extra ~5% founder dilution
- 10% pool: Extra ~2.5% founder dilution
- Savings: 2.5 percentage points
7.4 Use revenue-based financing or venture debt for growth capital
Instead of raising $3M Series A for growth marketing, consider:
- $1.5M equity Series A (15% dilution)
- $1.5M revenue-based financing (0% dilution, repay from revenue)
Total dilution: 15% instead of 30%.
Trade-off: Debt must be repaid, reduces cash flow.
7.5 Bootstrap longer before raising
Example:
- Scenario A: Raise seed at $2M valuation → own 40% post-seed
- Scenario B: Bootstrap to $500k revenue, then raise seed at $8M valuation → own 45% post-seed
Savings: 5 percentage points by delaying raise and proving more traction.
Frequently asked questions about equity dilution
How much equity do founders typically lose per funding round?
Founders typically lose 5–15 percentage points per round: Seed (10–20% dilution), Series A (15–25%), Series B (15–25%), Series C+ (10–20%). After 3–4 rounds, founders often own 15–30% combined, down from 50% each (2 co-founders) at inception. But absolute value increases if valuation grows faster than dilution.
How do I calculate dilution from a funding round?
Formula: New Ownership % = Old Ownership % × (1 – Investor %). Example: You own 50%, investors get 20% of post-money. Your new ownership: 50% × (1 – 20%) = 40%. For multiple rounds, compound: Final Ownership = Initial Ownership × (1 – r₁) × (1 – r₂) × (1 – r₃), where r₁, r₂, r₃ are investor percentages per round.
How do option pools affect founder dilution?
Option pools (10–20% post-money) dilute founders before investor dilution. Example: Investor wants 20%, option pool 15% post-money. Founders diluted by both: own 70% post-round (not 80%). Option pool top-ups between rounds dilute existing shareholders proportionally. Always model option pool impact separately from investor dilution.
What is anti-dilution protection and how does it affect founders?
Anti-dilution protects investors in down rounds by giving them extra shares to compensate for lower price. Full ratchet (worst for founders): investor price adjusts to new lower price entirely. Weighted average (standard): investor price adjusts proportionally based on new capital raised. Down rounds with anti-dilution can cause 30–60% founder dilution (vs 15–25% in up rounds).
What tools can I use to simulate equity dilution?
Free calculators: SeedBlink, Ideaproof, Futureproof, UserJot (no signup). Cap table software: Carta ($2k–$15k/year), Pulley (free–$500/month), AngelList Stack (free). DIY: Excel/Google Sheets templates with formulas for price per share, new shares issued, ownership percentages, and exit value scenarios. Model base, optimistic, and pessimistic cases before negotiations.
How can founders minimize dilution?
Raise at higher valuations (every $5M increase saves ~5 percentage points), raise less capital per round (trade runway for lower dilution), negotiate smaller option pools (10–12% vs 20%), use revenue-based financing or venture debt for growth capital (non-dilutive), and bootstrap longer before raising (prove more traction = higher valuation).
Suggested visuals to create
- Founder ownership trajectory chart
Line graph showing typical founder ownership from 50% (incorporation) → 40% (post-seed) → 30% (post-A) → 25% (post-B) → 20% (post-C), with shaded ranges showing typical variance. - Dilution vs absolute value comparison
Dual-axis chart: Left axis shows ownership % declining (50% → 20%), right axis shows absolute value increasing ($0 → $100M), demonstrating that dilution can still create wealth if valuation grows. - Option pool dilution mechanics diagram
Visual showing how 15% post-money option pool dilutes founders before investor stake: Starting 100% → Option pool created (founders 85%, pool 15%) → Investor gets 20% (founders 68%, pool 12%, investor 20%).
