Learn the market sizing framework that separates compelling pitches from fantasy—TAM, SAM, SOM calculations explained with real data and founder examples.
You’re on slide 23 of your pitch deck. The investor leans forward. “So what’s your total addressable market?” You click to a slide showing a $50 billion TAM number in massive type—the kind of number that makes VCs instinctively skeptical because they’ve seen it a thousand times, calculated backwards from “we’ll capture 0.1% and become a unicorn.”
Here’s the uncomfortable truth: most TAM/SAM/SOM slides are either wildly inflated or missing the actual narrative. Founders either use industry reports uncritically (healthcare TAM is $2 trillion—not useful), build bottom-up from their beachhead (realistic but tiny), or mix methodologies and confuse LPs.
The investors who ask sharp questions aren’t trying to bust you. They’re checking if you understand your own market economics. Get it right, and you signal founder rigor. Get it wrong, and they assume you haven’t validated your core assumptions.
This guide breaks down TAM/SAM/SOM math, how to calculate defensibly, what VCs actually believe, and how to avoid the three mistakes that kill market sizing credibility.
Table of Contents
- Why market size matters more than you think
- TAM, SAM, SOM definitions and how they differ
- Bottom-up vs top-down TAM calculations
- Real examples: SaaS, fintech, consumer, and deep-tech sizing
- The mistakes that kill investor confidence
- How to research and validate market numbers
- FAQ on market sizing and investor expectations
Why market size matters more than you think
Market size isn’t just a vanity metric
Investors care about TAM/SAM/SOM because it determines venture return potential. A $500M TAM company can return 5x; a $50B TAM company can return 100x+. If you’re asking for $20M at $150M post-money, the VC needs to believe there’s a $3-5B market where you can capture 5-10% within 10 years. Otherwise, math doesn’t work.
TAM/SAM/SOM also reveals whether you understand your customer. A founder who says “our TAM is healthcare at $2T” hasn’t thought through specificity. One who says “we’re targeting orthopedic surgeons in the US doing over $1M annual revenue” (maybe $8-12B market) has done the homework.
The benchmark: what do VCs expect?
For early-stage (seed), VCs want a “large enough market”—$1B+ TAM is comfortable, $500M minimum. For Series A, they want $2-5B+ TAM with realistic path to $500M+ revenue. For Series B/C, they’re evaluating TAM expansion, not market existence.
Missing the minimum TAM kills deals. Having an unrealistic TAM kills credibility just as fast. A $100B TAM that doesn’t withstand two minutes of scrutiny signals either fraud or laziness.
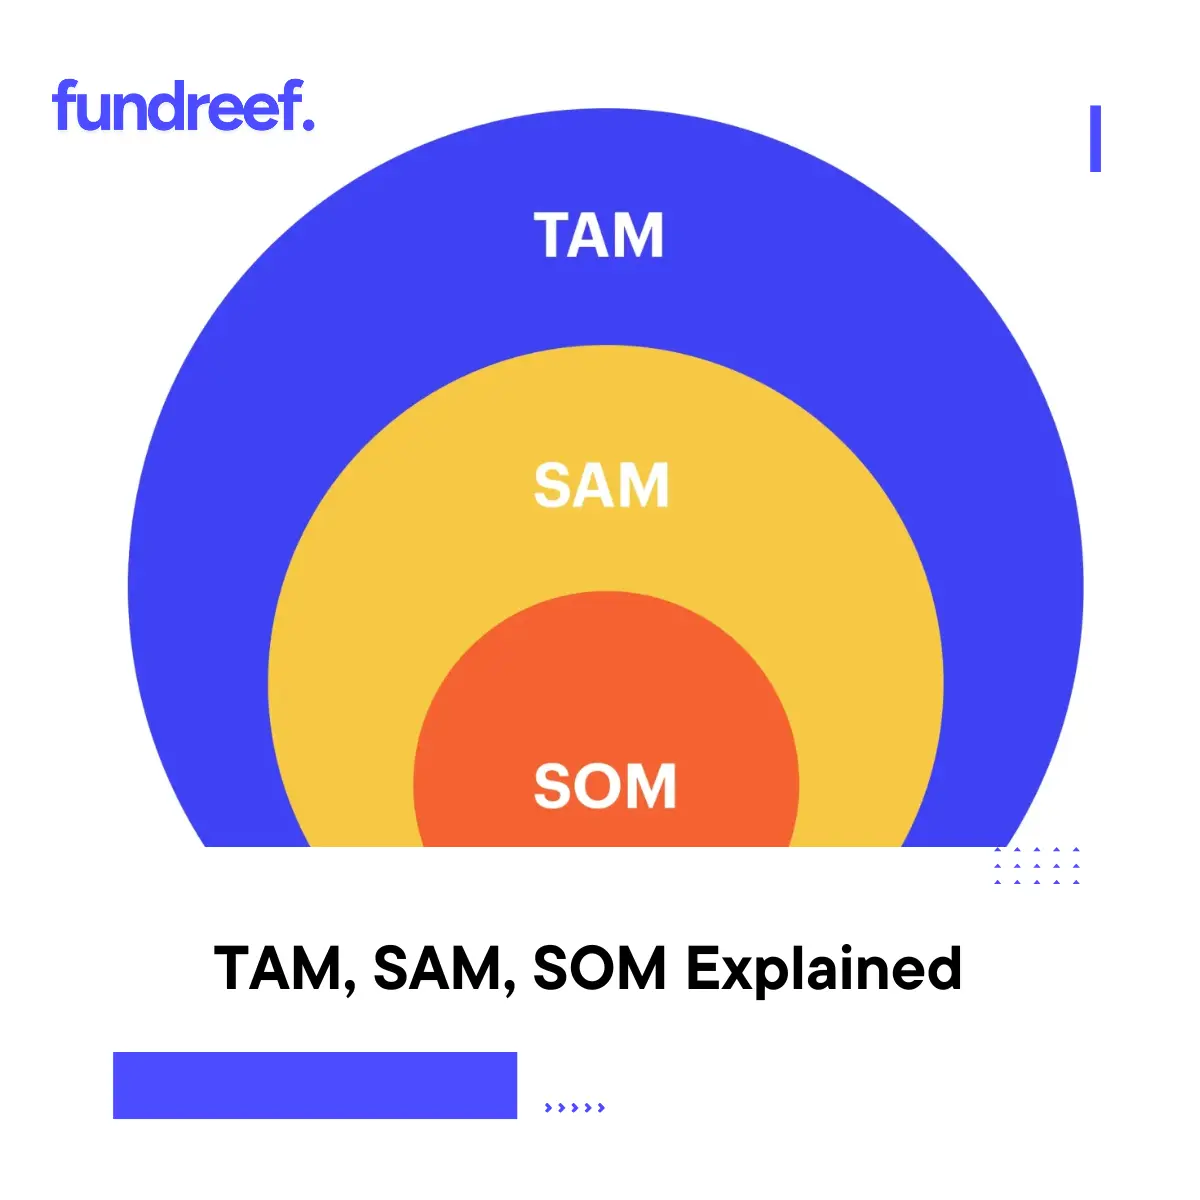
TAM, SAM, SOM definitions and how they differ
TAM: Total Addressable Market
TAM is the total revenue available if you captured 100% of a market. For Stripe in 2010, TAM was global payment processing: $20-30 trillion in annual transactions. For a telemedicine startup in 2015, TAM was remote healthcare consultations in developed markets: maybe $50-100B globally.
The problem: TAM is so broad it’s almost useless. Stripe’s $30T TAM included high-frequency trading, ATM withdrawals, and cash purchases—none of which they’d ever touch. Founders extrapolate TAM from industry reports, which quote gross numbers without segmentation.
How to calculate TAM:
- Identify the total addressable market (usually industry reports, Gartner, government data)
- Narrow by geography and segment (US only? enterprise only?)
- Size your addressable segment (often $1-50B for venture targets)
Founders often overstate TAM by 2-5x by including adjacent segments they’ll never reach.
SAM: Serviceable Addressable Market
SAM is the slice of TAM you can realistically capture given geography, customer segment, and competitive positioning. If Stripe’s TAM is $30T, their SAM in 2010 was online merchants in developed countries: maybe $200-300B. Still huge, but defensibly within reach via internet distribution.
SAM forces specificity. It says: “Here’s the market that wants our solution, can afford it, and we can reach economically.”
SAM calculation:
- Define your target customer segment (e.g., B2B SaaS, $10M+ ARR, US-only)
- Count addressable customers × average revenue per customer
- Result is SAM
Example: If there are 5,000 B2B SaaS companies in the US with >$10M ARR, and your average deal is $100k/year, SAM = 5,000 × $100k = $500M.
SOM: Serviceable Obtainable Market
SOM is the realistic revenue you’ll capture in a defined timeframe (usually 3-5 years), given execution, capital, and competition. If SAM is $500M, your SOM might be $10-20M by year 3 (2-4% of SAM).
SOM is where founders usually lose credibility. They’ll claim they can capture “5% of SAM by year 5” without justifying how they’ll convert customers faster than incumbents. Credible founders show customer acquisition cost (CAC), sales velocity, and churn to justify SOM.
| Metric | TAM | SAM | SOM |
|---|---|---|---|
| Definition | Total addressable if 100% captured | Realistic segment your model addresses | What you’ll actually capture in 3-5 years |
| Scope | Broadest | Middle | Specific to your plan |
| 2024 Example (EdTech) | Global online learning: $250B | US K-12 math tutoring: $8-10B | Your capture by Y5: $20-50M |
| How validated | Industry reports | Bottom-up customer count | CAC × conversion × retention |
| What kills credibility | Uncritical from reports | No supporting math | Ignores competition/churn |
Bottom-up vs top-down TAM calculations
Bottom-up: the founder-friendly method
Count customers × revenue per customer. If you know there are 50,000 potential customers and your pricing is $10k/year, TAM = $500M.
Pros: Specific, defensible, shows you’ve done customer research.
Cons: Requires actual customer enumeration; harder for new categories.
Example: A logistics SaaS founder counts:
- 15,000 mid-market logistics companies in North America
- × $50k average annual software spend
- = $750M SAM
She then validates by identifying 50-100 companies in her ICP, checking their team size, revenue, tech stack. Top-down number aligns with bottom-up reality.
Top-down: the investor skepticism slide
Take industry TAM (Gartner, McKinsey), multiply by your capture assumption. Global SaaS market is $200B, assume 2% growth to $250B, claim your startup will capture 0.5% = $1.25B TAM by year 10.
Pros: Large numbers, industry credibility.
Cons: Ignores competition, product viability, your actual path to capture.
Why it backfires: “Global SaaS TAM is $250B” includes Microsoft, Salesforce, and 10,000 other companies. Your $2M ARR startup capturing 0.5% assumes you displace incumbents or expand market 100x—neither credible on slide 23.
The winning formula: both
Start with top-down to establish market magnitude. Then bottom-up to show specificity. A B2B payments startup:
- Top-down: Global payments software: $100-150B market (Gartner)
- Narrow to SAM: US mid-market, $1-10M ARR, SMB underserved: $8-12B
- Bottom-up validation: 12,000 qualifying companies × $100k-500k contract value = $1.2-6B SAM
- SOM: Target $50M ARR by Y5 = 4% of SAM (justified by CAC payback < 12 months, churn <5%)
The investor sees the work.
When building financial models to justify your SOM assumptions, Fundreef’s AI-powered company valuation tool helps you cross-check your TAM/SAM/SOM against comparable companies in your sector, ensuring your projections align with market benchmarks and investor expectations.
Real examples: SaaS, fintech, consumer, and deep-tech sizing
Example 1: Enterprise SaaS (HR tech)
TAM: Global HR software market ~$30B annually (Gartner 2024)
SAM: US mid-market companies (500-5K employees), underserved by legacy providers like Workday/SuccessFactors = ~$3-4B (estimated from 8,000 companies × $400k avg contract)
SOM (Y3-5): Realistically capture $30-50M ARR serving 100-150 accounts = 1-1.5% of SAM
Why credible:
- TAM from authoritative source
- SAM narrowed to specific customer size + pain point
- SOM justified by: average deal size ($300-500k) × realistic sales cycles (6-9 months) × churn assumption (8-10% annual)
Why it fails:
- If you claim “we’ll get to $500M ARR by Y5” (1.5x SAM growth) without explaining market expansion or TAM shift, you lose credibility
Example 2: Fintech (lending)
TAM: Global SMB lending: $500B+/year in originated loans (world bank data)
SAM: US SMB unsecured term loans, $50k-500k, underserved by traditional banks = $40-60B annual volume (estimated from 6M eligible SMBs × $50k avg loan)
SOM (Y3-5): Capture $200-300M in annual loan originations = 0.5% of SAM
Why credible:
- TAM from public data (global lending stats)
- SAM narrowed to your underserved segment (SMBs rejected by banks)
- SOM includes unit economics: average loan size × origination velocity × portfolio growth
Why it fails:
- If you ignore default rates (10-15% in SMB lending), your $300M SOM projection evaporates under underwriting costs
Example 3: Consumer (grocery delivery)
TAM: US grocery market ~$800B/year (all channels)
SAM: Urban grocery delivery, 30 metro areas, $15-150B potential = 2-20% of total market (estimates vary by urban penetration)
SOM (Y3-5): $100-500M annual revenue (depends on expansion speed and unit economics—harder to justify than B2B)
Why credible:
- TAM from USDA/census
- SAM reflects current delivery penetration (10-15% of grocery spend in metros)
- SOM includes CAC (~$10-30 per customer), LTV (lifetime value from repeat orders), and market share assumptions
Why it fails:
- Consumer is hardest to project. If margins are negative and churn is 20%/month, $500M SOM evaporates. Instacart proved the model, but market fragmentation limits new entrants.
Example 4: Deep-tech (climate tech)
TAM: Global industrial decarbonization: $500B+ market (IEA estimates)
SAM: Steel production CO2 reduction, direct air capture tech, US/Europe = $50-100B addressable (subset of industrial decarbonization VCs can fund)
SOM (Y5-7): Realistically $50-200M annual revenue (longer sales cycles, regulatory dependencies)
Why credible:
- TAM from authoritative climate research
- SAM narrowed to specific hard-to-decarbonize sector
- SOM reflects true capex cycles (15-24 months sales, capital-intensive deals)
Why it fails:
- If you overestimate policy tailwinds (carbon credit prices, subsidy certainty) without regulatory sensitivity analysis, your SOM collapses if political conditions shift
The mistakes that kill investor confidence
Mistake 1: Uncritical industry TAM
You find a Gartner report saying “cloud ERP market $180B.” You use that as your TAM. But $180B includes all vendors (SAP, Oracle, Microsoft), all geographies, and all company sizes. An investor immediately discounts your TAM to relevant segment.
Fix: Cite Gartner but narrow. “Gartner estimates cloud ERP at $180B; we target mid-market SMBs (50-1000 employees) in North America, which represents $8-12B of that.”
Mistake 2: No customer validation for SAM
You claim your SAM is $5B but haven’t actually counted customers or validated pricing. You extrapolated from one industry report and hoped.
Fix: Count customer universe yourself. “There are 8,400 mid-market manufacturers in the US (per Census Bureau). We surveyed 50; 40 have our problem and would pay $200-500k annually. SAM = 8,400 × $350k = $2.9B.”
Mistake 3: SOM ignores competition
You claim 5% of SAM by year 3. But you haven’t addressed Salesforce, HubSpot, or three well-funded competitors all chasing the same segment.
Fix: “We target niche verticals (e.g., commercial real estate) where incumbents under-invest. Year 1-2, we acquire at 3% CAC payback; Year 3, we’ve built switching costs (compliance workflows) that reduce churn to 5%. We project capturing 2-3% of our SAM subset within that timeline, or $50-75M ARR.”
Mistake 4: No path from SOM to profitability
You claim $500M revenue SOM but unit economics are negative and you’ve ignored it.
Fix: Model unit economics: CAC, LTV, churn, gross margin. “At $300k ACV and $50k CAC, payback is 8 months. With 10% churn and 90% gross margin, we hit 40% EBITDA margin at $200M ARR.” Then SOM feels believable.
Mistake 5: Confusing growth rate with market capture
“Our TAM grows 20%/year, so by year 10 we’ll capture a significant share.” That’s not how it works. Market growth ≠ your growth. Stripe grew faster than payment processing TAM growth because they took share from incumbents.
Fix: Separate TAM growth from your SOM. “Market grows 8%/year; we grow 80% by selling to underserved segments, then eventually compete for mainstream at slower growth rates.”
How to research and validate market numbers
Primary research: the founder advantage
Talk to 50-100 potential customers. Document:
- Problem severity (“How many are frustrated with current solution?”)
- Willingness to pay (“What would you pay?”)
- Competitive alternatives (“What do you use today?”)
- Buying process (“Who approves purchases? What’s the timeline?”)
A founder who speaks from customer research beats one with Gartner citations.
Data sources that hold up to scrutiny
- Government: Census Bureau (business counts), IRS (revenue/industry), BLS (employment)
- Authoritative reports: Gartner, McKinsey, BCG, Forrester (but narrow and cite specific report)
- Industry associations: NAM (manufacturing), ABA (banking), NCHS (healthcare)
- Comparable companies: If Stripe’s TAM grew from $200B to $500B claimed market, learn their methodology
- Regulatory filings: 10-Ks reveal TAM claims from public competitors
The spreadsheet test
Build a model that shows:
- TAM source with citation
- SAM calculation with customer count × pricing
- SOM projection with CAC, LTV, churn, margin assumptions
- Sensitivity analysis showing how SOM changes with ±10-20% customer count or pricing variance
If SAM collapses with small assumption changes, it’s not defensible.
When you’re projecting revenue and building financial scenarios to back your SOM claims, Fundreef’s AI-powered business plan tool can help you model multiple market capture scenarios with built-in benchmarks, ensuring your TAM/SAM/SOM sits within investor credibility ranges for your sector.
Common questions about market sizing
How big does TAM need to be for venture funding?
Seed: $500M minimum TAM, $1B+ preferred. Series A: $2-5B+ TAM. Series B+: $10B+ TAM with credible path to dominant position. Below $500M TAM, most VCs pass unless you’re already at $10M+ ARR (which de-risks market size). Geographic/segment focus matters—$1B SAM in US healthcare is easier to defend than $50B global TAM.
Bottom-up or top-down—which approach do investors prefer?
Both, cross-checked. Start with top-down (industry credibility), validate with bottom-up (customer reality). If they don’t align, fix your assumptions. Pure top-down signals you haven’t done customer work; pure bottom-up might miss growth upside.
Should I include TAM expansion assumptions?
Only if credible. “We initially target SMB accounting (SAM $2B), then expand to mid-market (TAM $5B) in year 3 as we add compliance features.” That’s defensible if your product roadmap justifies it. Don’t claim TAM expansion that depends on regulatory changes or competitor failure.
How does competition affect SAM/SOM?
SAM shrinks if competitors are strong; SOM gets more realistic. “SAM is $5B, but Intuit/QuickBooks owns 40%, so competitive SAM is ~$3B.” Investors respect honesty about competition over naive TAM claims.
What’s a realistic SOM percentage of SAM?
By year 3-5: 1-5% for B2B (depends on go-to-market, CAC, industry). 5-15% for consumer (faster adoption but higher churn). Deep-tech: 0.5-2% (long sales cycles). If you’re claiming 10%+ of SAM in SaaS, justify why you’ll move faster than incumbents.